How to use
- Add new PCM
- Add new measurement
- Enthalpy measurement
- Viscosity measurement
- Density measurement
- Thermal conductivity measurement
- Thermal diffusivity measurement
Add new PCM
- Select material type
- Give material designation (the name of the material)
- Give a description
- Put the Institution you belonging to (uploading the material)
- Give a reference (e.g. doi of paper published the result, reference should best be a web address)
- Choose if the material is a commercially available material or not
- In case it is commercially available it should have a CAS-No.
- Give the manufacturer if available
- Save your entry
- After uploading all data available press Publish then the request is sent to the reviewers. If the data is accepted, it will be published and available for all visiting the web site. You will get feedback if there will be revision necessary
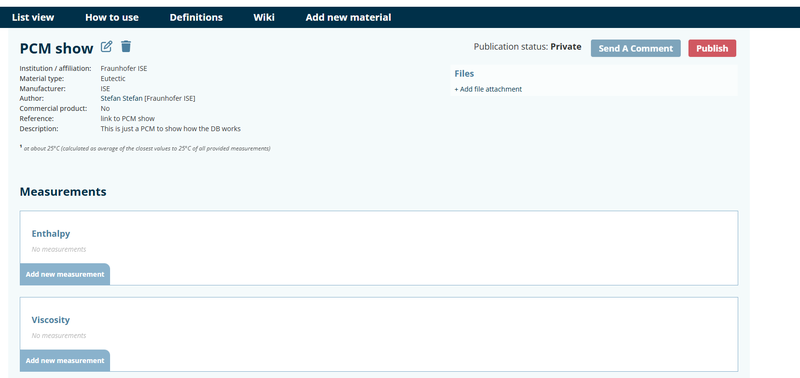
The following figure shows how it looks like after saving the material. Now it is possible to upload data for enthalpy, viscosity, density, thermal conductivity and thermal diffusivity. Here it is also possible to upload files. We recommend to upload documents in pdf format.
Add new measurement
- Choose "Add new measurement"
- It is possible to put measurements for different samples of this material measured. Give each sample measured a (unique) number starting from sample 1 to sample n. It is recommended to measure 3 samples. Sample number are then 1, 2, 3
- Give the device with which the sample was measured (e.g. for Enthalpy Q2500 TA-Instruments)
- Choose the standard according to which the material was measured. If your standard is not listed please attach a description of the standard used as a pdf, or send a message asking for adding an new standard to the list of standards available to choose in the database (Send A Comment" on the material level).
- Data table must be uploaded in ASCII format encoded according to ISO 8859-1 standard
Enthalpy measurement
The database is designed here to upload data measured with DSC
- Give heating and cooling rate for the measurement
- Give the mass of the measured sample
- Give all requested values with uncertainties if possible (temperature values in °C uncertainty of temperature in K, Enthalpies should be given in kJ/kg)
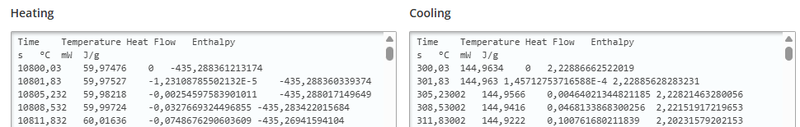
- Upload the data tables separate for the heating and cooling measurement. Data table must be organized like shown in the following figure. Order of columns must be time [s], temperature [°C], heat flow [mW], enthalpy [kJ/kg], 1 and fourth column are plotted in the graph.
- Each dataset contains a heating and a cooling measurement, and you must put a unique number for the dataset, starting from 1. Increase the number by 1 for each additional dataset uploaded for this sample.
- Use add measurement to upload the data.
- You can upload more than one measurement for this sample measured according to the given set of DSC-parameters
Viscosity measurement
Procedure is quite similar to the one given for the enthalpy measurement. It is expected to use rotary rheometer. If another principle is used and you are not able to use the predefined parameters please give the description key parameters for your measurement in a separate document uploaded in the file section. Data to be given is:
- Used geometry (cup-cylinder, plate-plate, etc)
- choose continuous or stepwise measurement
- Give heating and cooling rates or temperature step and uncertainties
- Upload data: Data tables have to be organized like shown in the next figure. First and second column are plotted in the graph.
- You can upload several data sets for this sample
- If you go back to material level, you can add other sample measurements for this material.
- Choose the dataset which should be shown in the graph by press "set as reference"
![Order of columns in the viscosity table. first column temperature [°C], second column viscosity values [mPa s]](/media/images/viscosity_table.max-800x450.png)
Density measurement
Procedure is quite similar to the one given for the viscosity measurement. Data to be given is:
- As basic data only uncertainties for density data and temperature is requested.
- If you store the basic measurement information you will be able to upload files e.g. describing your measurement approach more detailed.
- Upload data has to be organized that the first column contains the temperature[°C]and the second the density values [kg/l].
- You can upload several data sets for this sample
- If you go back to material level you can add othere sample measurements for this material.
- Choose the dataset which should be shown in the graph by press "set as reference"
Thermal conductivity measurement
Procedure is quite similar to the one given for the viscosity measurement. Data to be given is:
- As basic data shape of the sample should be given. If square the give sample thickness, sample length and width. In case of round sample length and width is taken as diameter. Other sample geometries need to be explained in the comments or in a separate document.
- Explain how you prepared the sample. e.g. which cooling rate was used to solidify the sample from the liquid.
- Give the purge gas used and its volume flow, if purge gas was used.
- If you store the basic measurement information you will be able to upload files e.g. describing your measurement approach more detailed.
- Upload data has to be organized that the first column contains the temperature [°C] and the second the thermal conductivity values [W/m K]. Third column can be e.g. the uncertainty for each measurement value.
- You can upload several data sets for this sample
- If you go back to material level you can add other sample measurements for this material.
- Choose the dataset which should be shown in the graph by press "set as reference"
Thermal diffusivity measurement
Procedure is quite similar to the one given for the thermal conductivity measurement. Data to be given is:
- As basic data, the shape of the sample should be given. If square, give sample thickness, sample length and width. In case of round sample length and width is taken as diameter. Other sample geometries need to be explained in the comments or in a separate document
- Explain how you prepared the sample. e.g. which cooling rate was used to solidify the sample from the liquid.
- Give the purge gas used and its volume flow, if purge gas was used.
- If you store the basic measurement information, you will be able to upload files e.g. describing your measurement approach more detailed.
- Upload data has to be organized that the first column contains the temperature [°C] and the second the thermal diffusivity values [mm²/s]. Third column can be e.g. the uncertainty for each measurement value.
- You can upload several data sets for this sample
- If you go back to material level, you can add other sample measurements for this material.
- Choose the dataset which should be shown in the graph by press "set as reference"